

Here you go, this looks at notable mega cap tech earnings. Idea is to show momentum into the print, the price reaction, how forward estimates changed - along with a comparison of reaction to estimate changes.
The scoring piece in the farthest right column compares Excess move with the momentum into the print, and the Excess move compares the stock reaction with the underlying earnings revisions:
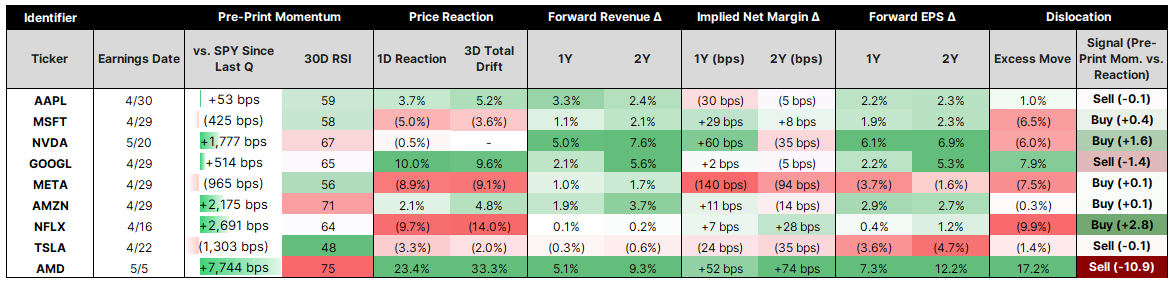
In the above, AMD is rated a deep red Sell because of the outrageous momentum into the print and the also outrageous stock reaction in excess of the underlying fundamentals changes. It’s not going to be perfect, but it should give you a guide for what to do with positions.
Thoughts? I plan to publish these either each weekend or on a rolling daily basis looking at earnings reactions from 3-5 days prior to catch the full earnings ‘drift’ + full sell side estimate update cycle.
Here’s another sector specific table for Semis:

Please comment!
I think I need a similar “Signal” column for the Setups
It might be just me, but I would prefer more narrative support the charts. I’ve got a ton of content to review daily and text highlighting the key factors is very helpful - as you do with the earnings set ups. Thanks.