
Earnings Edge for Monday: Setups for Cadence Design Systems, Nucor, Verizon, Public Storage, Ventas, Amkor Technology, Rambus, Domino's Pizza, Crown Holdings, and Many More

Relative winners and losers over the last quarter, followed by names of note, concluding with a spreadsheet containing setup tables for all of the day’s reporters.
Relative Winners and Losers

Names of Note
Cadence Design Systems (CDNS)

Bull Bullets: Record $7.8B Backlog and Agentic AI Design Tools Anchor Multi-Year EDA Growth
Cadence enters 2026 with a record $7.8B backlog covering approximately 67% of guided revenue ($5.9-$6.0B), providing exceptional visibility for a software company. The ChipStack AI Super Agent launch and expanded NVIDIA collaboration for agentic AI design flows are driving adoption from “almost every customer,” with Samsung reporting 4x productivity improvements using Cerebrus AI Studio and select customers seeing 7-10x gains on specific RTL tasks.
IP revenue grew nearly 25% in 2025 and core EDA grew 13%, while the System Design & Analysis segment grew 13% on demand for 3D-IC and simulation solutions essential to AI infrastructure. Each new process node (3nm, 2nm) and advanced packaging generation (2.5D, 3D-IC) structurally expands Cadence’s TAM by requiring more sophisticated design and verification tools, creating a compounding revenue opportunity.
FY2026 guidance for non-GAAP EPS of $8.05-$8.15 (vs. prior consensus of $5.45) and non-GAAP operating margins of 44.75%-45.75% represents a meaningful acceleration, and the stock at roughly $280 trades at 35x forward earnings, compressed from its historical premium due to broader EDA sector weakness, offering a potential entry point if Q1 confirms the AI tool momentum.
Bear Bullets: China Exposure, Hexagon Integration Risk, and Premium Valuation Under Pressure
China is expected to contribute 12-13% of 2026 revenue, and management’s guidance explicitly assumes export control regulations remain “substantially similar,” creating binary downside risk if U.S.-China tensions escalate or if additional restrictions are imposed on EDA tool sales to Chinese semiconductor firms, which would be nearly impossible to offset in the near term.
The pending Hexagon D&E acquisition (excluded from guidance) adds integration complexity and dilution risk, and if the deal faces regulatory delays or the industrial simulation market proves more competitive than expected, Cadence could face a period of elevated spending without commensurate revenue contribution, muddying the clean organic growth narrative.
Hardware demand visibility remains uncertain for the second half, and with 40 insider sales and zero purchases over the past six months, the stock faces valuation skepticism even at its compressed multiple; any deceleration in AI tool attach rates or a slowdown in hyperscaler chip design activity could trigger a retest of the $221 low.
Key Investment Thesis
Cadence Design Systems provides EDA software, hardware, and IP used to design and verify semiconductors, SoCs, and electronic systems across computing, automotive, mobile, and AI infrastructure.
Upside Case: If AI-driven design complexity continues to expand TAM per node, ChipStack adoption accelerates across the customer base, and the hardware cycle sustains into 2H 2026, Cadence could deliver upside to the $8.10 EPS midpoint while maintaining 45%+ operating margins, supporting a re-rating toward $350-380 as the market re-prices the AI design tool narrative.
Downside Case: If China export controls tighten, hardware orders slow in H2, or AI tool monetization disappoints relative to elevated expectations, the stock could retrace toward $220-250, particularly if Synopsys or emerging open-source EDA alternatives gain competitive traction.
Differentiation: Cadence and Synopsys form an effective duopoly in EDA (~60% combined market share), and Cadence’s first-mover position in agentic AI chip design workflows, combined with its expanding system design and IP portfolio, creates deep customer lock-in that makes switching costs prohibitively high for semiconductor designers.
Nucor (NUE)

Bull Bullets: 50% Tariff Shield, $20B Capex Cycle Completion, and FCF Inflection Create Earnings Uplift
The 50% Section 232 tariff regime on imported steel, recently strengthened by the White House in early April 2026, has structurally raised the domestic price floor and pushed import share below 15%, creating a multi-year margin tailwind for Nucor that analysts at Goldman Sachs, Wells Fargo, and UBS have all cited in recent upgrades. Consensus EPS of $12.57 for 2026 represents a 63% jump from 2025’s $7.71, driven by higher realized pricing and a 5% increase in planned steel mill shipments.
Nucor’s $20B capital investment program since 2020 is now entering the payoff phase, with four major projects completed in 2025 expected to contribute roughly $500M in incremental EBITDA above 2025 levels. The West Virginia sheet mill, targeting the untapped automotive and appliance EAF market, is two-thirds complete and on track for startup before year-end 2026, opening a structural pricing premium segment where EAF producers have not previously competed.
With 2026 capex declining to approximately $2.5B (from $3.4B in 2025), Nucor’s free cash flow is inflecting sharply from negative territory in prior years to an estimated $1.3B+ in 2026, and the $4B buyback authorization provides a meaningful catalyst for per-share earnings growth at current price levels around $186.
Bear Bullets: Tariff Durability Uncertainty, Cyclical Demand Risk, and Stretched Expectations
The entire 2026 earnings case hinges on the durability of 50% tariffs, which could be reduced in USMCA renegotiation (July 2026), used as a negotiating chip in broader trade deals, or challenged through WTO mechanisms. The analyst target spread of $138-$210 reflects genuine disagreement about whether this policy is permanent or temporary, and any tariff reduction would compress domestic steel pricing and invalidate the consensus earnings trajectory.
Steel demand is correlated with industrial production and construction activity, and the macro backdrop remains uncertain with rising recession concerns, trade-war-related demand destruction, and the potential for higher interest rates to slow construction starts; Nucor’s 40% year-over-year growth in steel mill backlogs is encouraging but could reverse quickly if end-market demand softens.
At roughly $186 and approximately 15x forward earnings on the consensus $12.57 estimate, Nucor is priced close to the mean analyst target of $192.80, leaving limited upside if the tariff-driven earnings acceleration is already fully discounted. Any operational misstep at West Virginia or a miss on the Q1 $2.70-$2.80 EPS guide could reset expectations lower.
Key Investment Thesis
Nucor is North America’s largest steel producer by capacity, operating electric arc furnace (EAF) mini-mills across steel mills, steel products, and raw materials segments.
Upside Case: If 50% tariffs prove durable through the USMCA renegotiation, the West Virginia sheet mill ramps on schedule into automotive markets, and infrastructure spending under the OBBBA accelerates steel demand, Nucor could deliver $13-14 EPS in 2027 and re-rate toward Wells Fargo’s $213 target on expanding FCF and buyback momentum.
Downside Case: If tariffs are reduced to 25% or lower, industrial production weakens amid a global slowdown, and the West Virginia startup encounters delays or cost overruns, Nucor’s earnings could stall near $10 EPS, compressing the stock toward the low-end $138 target.
Differentiation: Nucor’s 100% EAF-based production model gives it the lowest carbon intensity among major steel producers and the most flexible cost structure (electric arc furnaces can be idled and restarted rapidly), creating structural advantages in both sustainability-focused procurement and cyclical downturns.
Verizon Communications (VZ)

Bull Bullets: Frontier Integration, Record Subscriber Adds, and FCF Acceleration Signal Inflection
Verizon’s Q4 2025 results delivered 616,000 postpaid phone net additions (best Q4 since 2019) and over 1 million total net additions across mobility and broadband (highest quarterly total since 2019), and 2026 guidance calls for 750,000-1,000,000 retail postpaid phone net adds, roughly 2-3x the 2025 reported level, signaling that the convergence strategy is gaining genuine traction.
The completed $20B Frontier acquisition expands Verizon’s fiber footprint to over 30 million passings across 31 states, with management targeting 40-50 million passings by 2028 and planning at least 2 million new fiber passings in 2026. The cross-selling opportunity between Frontier’s broadband customers and Verizon’s premium mobility, home internet, and streaming offerings creates a durable growth engine that structurally reduces churn.
2026 guidance for adjusted EPS of $4.90-$4.95 (+4-5% growth), free cash flow of $21.5B+ (highest since 2020, +7% YoY), and operating cash flow of $37.5-$38.0B provides a compelling income story with a 6%+ dividend yield, supported by improving growth metrics that could attract generalist investors back to a name that has been largely abandoned for growth alternatives.
Bear Bullets: $178B Debt Load, Competitive Intensity, and Integration Execution Risk
Verizon’s massive debt burden (over $178B in total obligations including the Frontier acquisition financing) constrains capital allocation flexibility and makes the balance sheet vulnerable to any sustained period of elevated interest rates. While management targets deleveraging, the pace of debt reduction will depend on executing the Frontier integration without revenue leakage or unexpected costs.
T-Mobile continues to take share in both wireless and fixed wireless access, and cable companies (Comcast, Charter) are aggressively expanding their MVNO mobile offerings, creating a three-front competitive war where Verizon must simultaneously defend its premium wireless positioning, grow broadband, and integrate Frontier without service disruptions.
The Zacks consensus Q1 EPS estimate of $1.22 and revenue estimate of $35.03B set a bar that requires demonstrating early Frontier integration momentum; any signs of subscriber churn in legacy Frontier markets, integration-related service quality issues, or a deceleration in the postpaid add trajectory could pressure the stock’s recent 25% 2026 rally.
Key Investment Thesis
Verizon Communications is the largest U.S. wireless carrier by revenue, now expanded into a converged connectivity provider with fiber broadband through the Frontier acquisition.
Upside Case: If Frontier integration proceeds smoothly, fiber cross-selling drives broadband net adds to 400,000+ quarterly, and wireless subscriber momentum sustains at 200,000+ postpaid phone adds per quarter, Verizon could re-rate from a pure income play to a “growth plus yield” story, supporting a path toward $60+ and total returns of 15%+ including the dividend.
Downside Case: If Frontier integration proves more costly or disruptive than planned, T-Mobile and cable MVNOs continue to pressure wireless ARPU, and the debt load constrains the pace of 5G and fiber investment, Verizon could underperform as a yield-trap at a time when treasury yields offer competitive returns with less risk.
Differentiation: Verizon’s combination of the nation’s most extensive 5G network, a rapidly expanding 30M+ fiber footprint, and the deepest spectrum portfolio among U.S. carriers creates a converged connectivity platform that neither T-Mobile (limited wireline) nor cable companies (limited wireless) can fully replicate.
Public Storage (PSA)

Bull Bullets: PS 4.0 Initiative, Fortress Balance Sheet, and New CEO Position PSA for Recovery
The leadership transition to Tom Boyle as CEO (effective April 1, 2026) under the PS 4.0 initiative, combined with executive share purchases, signals management confidence in a strategic reset designed to enhance shareholder value through AI-driven operational efficiency, digital customer engagement, and a revamped approach to revenue management that could stabilize same-store performance ahead of schedule.
PSA’s balance sheet remains one of the strongest in the REIT sector with debt plus preferred equity to EBITDA at 4.2x, $1.8B in available liquidity, $600M in annual free cash flow, and a net leverage well below the 5-6x levels common among peers. This financial fortress provides unmatched optionality for accretive acquisitions (87 facilities acquired for $946M in 2025) during a period when smaller competitors face refinancing stress.
With the broader REIT sector outperforming the general market in Q1 2026 and rate-cut expectations supporting REIT valuations, PSA’s 3.8% dividend yield and brand dominance (3,533 facilities, 258M net rentable sq ft) offer a defensive positioning advantage if economic conditions deteriorate and drive increased demand for affordable storage as consumers downsize.
Bear Bullets: Negative Same-Store NOI Growth, Supply Glut, and Revenue Compression Cloud Near-Term
2026 guidance for same-store NOI growth of negative 3.9% to negative 0.5% and same-store revenue growth of negative 2.2% to flat confirms that the self-storage industry’s post-pandemic normalization cycle is not yet complete. Street move-in rates remain depressed, and existing customer rate increases (ECRI) are meeting greater resistance as competitors aggressively price to fill vacancies.
The 133% payout ratio on trailing earnings raises dividend sustainability questions if same-store performance does not recover, and the 2.05x debt-to-equity ratio, while manageable, limits flexibility to simultaneously pursue acquisitions and maintain the dividend at current levels if market conditions deteriorate further.
Analyst estimates have been revised downward 0.6% over the past 30 days, and the core FFO guidance midpoint of $16.68 represents a 1.7% year-over-year decline, suggesting that the PS 4.0 technology investments and AI initiatives have not yet offset the structural revenue headwinds from market saturation and intensifying competition from new supply additions.
Key Investment Thesis
Public Storage is the largest owner-operator of self-storage facilities in the U.S. and a member of the S&P 500, with 3,533 properties across 40 states and a 35% interest in Shurgard (Europe).
Upside Case: If rate cuts materialize in H2 2026, housing turnover increases (a key driver of storage demand), and PS 4.0 technology initiatives improve pricing optimization and customer acquisition costs, PSA could exit 2026 at the high end of its FFO range ($17.00), setting up a recovery narrative into 2027 that supports the current $340+ valuation.
Downside Case: If same-store revenue declines persist or worsen, new supply deliveries in Sunbelt markets exceed absorption, and interest rates remain elevated, PSA’s premium multiple could compress toward historical trough levels, with the stock vulnerable to a pullback toward $290-300.
Differentiation: PSA’s unmatched scale (largest by facility count and revenue), brand recognition, and digital customer acquisition platform create structural competitive advantages in a fragmented industry where the top five operators control less than 25% of total supply.
Ventas (VTR)

Bull Bullets: Demographic Super-Cycle and Record Acquisition Pipeline Drive Double-Digit NOI Growth
Ventas is riding the most powerful demographic tailwind in REIT history: the 80+ population is expected to grow by 501,000 annually from 2024-2026 and accelerate to 854,000 annually from 2027-2030, while new senior housing construction remains near record lows at just 0.5% year-over-year inventory growth. This supply-demand imbalance has powered four consecutive years of double-digit SHOP same-store cash NOI growth (15%+ in 2025), and management expects a fifth consecutive year in 2026.
The investment pipeline is massive and accelerating: Ventas has already closed $842M in senior housing acquisitions year-to-date 2026 and is highly confident in completing $2.5B for the full year, bringing cumulative senior housing acquisitions to $7.3B in just over two years. With half of 2026 deals sourced off-market, the company’s proprietary OI analytics platform and expanded operator network (from 10 to 43 SHOP operators since 2020) provide deal-sourcing advantages that scale with portfolio size.
2026 normalized FFO guidance of $3.83/share at midpoint (+8% YoY), combined with the 8% dividend increase to $0.52/quarter and TSR exceeding 35% in 2025, positions VTR as a premier growth-plus-income healthcare REIT. Enterprise value now exceeds $50B with net debt-to-EBITDA at a manageable 5.2x.
Bear Bullets: SHOP Operator Risk, Equity Dilution, and Rising Competition for Deals
As SHOP rises to over 53% of portfolio NOI, Ventas is increasingly exposed to operator execution risk, labor cost inflation (senior care staffing remains a persistent industry challenge), and occupancy sensitivity. Unlike triple-net lease structures where rent is contractually fixed, SHOP economics depend on operators maintaining margins through rate increases and occupancy gains, which could stall if a recession reduces discretionary senior housing move-ins.
The $2.5B annual acquisition program is being funded principally with equity ($3.2B raised in 2025, $1.2B in unsettled forward agreements outstanding), creating meaningful dilution pressure on per-share metrics. If marketed deal competition intensifies (management noted this trend), cap rates could compress to levels where incremental acquisitions are less accretive, reducing the return on deployed capital.
Ventas generated only $0.54 in GAAP net income per share on $5.8B in revenue, highlighting the significant gap between FFO and true economic earnings. Rising interest rates would simultaneously increase the cost of acquisition financing and reduce the relative attractiveness of REIT yields versus treasuries, potentially compressing the multiple.
Key Investment Thesis
Ventas is an S&P 500 healthcare REIT with approximately 1,400 properties, focused primarily on senior housing operating communities (SHOP), outpatient medical, and research facilities.
Upside Case: If the demographic-driven senior housing demand cycle continues to outpace supply through 2030, SHOP occupancy recovers toward pre-pandemic levels (currently still below 2019), and the $2.5B annual investment pipeline delivers 7-8% unlevered returns, Ventas could compound FFO at 8-10% annually through 2028, supporting a path toward $85+.
Downside Case: If labor cost inflation erodes SHOP margins, a recession slows senior housing move-in rates, or cap rate compression makes acquisitions less accretive than modeled, the equity dilution from funding the growth pipeline could cause FFO per share to stagnate despite growing portfolio NOI, trapping the stock in the $55-65 range.
Differentiation: Ventas’s combination of the largest diversified SHOP portfolio in the REIT sector, a proprietary OI analytics platform for operator selection and asset optimization, and an expanding network of 43 operating partners creates a data-driven competitive advantage that no other healthcare REIT can match at scale.
Amkor Technology (AMKR)

Bull Bullets: AI Packaging Bottleneck Makes Amkor a Critical Infrastructure Chokepoint
Amkor is positioning itself as the “release valve” for constrained AI accelerator supply, with advanced packaging platforms (2.5D integration and high-density fan-out) expected to nearly triple in volume over the course of 2026. Computing revenue is expected to grow more than 20% year over year, driven by structural demand from AI accelerator packaging, HBM4 memory integration, and chiplet-based CPU architectures that require increasingly sophisticated backend assembly.
The $2.5-$3.0B capex plan for 2026, including the aggressive Arizona facility buildout, signals management confidence in sustained multi-year demand from major customers including Apple and NVIDIA. Hedge fund ownership has jumped from 35 to 48 portfolios, and Needham recently raised its price target to $65 (from $50) while Aletheia sees meaningful H2 upside from hyperscale and networking customer ramps.
Two CPU HDFO programs are in final qualification targeting high-volume production launch in H2 2026, plus an AI PC-related device ramp in early 2026. Management is targeting roughly 30% incremental flow-through in 2026 from operational excellence, Japan optimization, improved pricing, and the continued mix shift toward higher-value advanced packaging work.
Bear Bullets: Front-Loaded Capex, Depressed Q1 Margins, and Customer Concentration Risk
Q1 2026 is guided as the seasonal low point with sales of $1.60-$1.70B, gross margin of just 12.5%-13.5%, and EPS of $0.18-$0.28. Front-loaded equipment spending is lifting depreciation expense in H1, meaning investors must look through near-term earnings compression and take management’s word that H2 will be meaningfully better, a classic “trust the ramp” story that carries execution risk.
The $2.5-$3.0B capex program represents a massive capital commitment for a company with approximately $7.5B in trailing revenue, and if AI accelerator demand slows, hyperscaler buildout timelines extend, or Intel’s advanced packaging volumes disappoint, Amkor could face a period of overcapacity that crushes margins and returns on invested capital.
Amkor’s customer base is highly concentrated in a handful of fabless giants (Apple, NVIDIA, Qualcomm, AMD) and one major IDM (Intel), creating dependency risk where a single customer’s product cycle shift or decision to in-source packaging could materially impact utilization rates and pricing power.
Key Investment Thesis
Amkor Technology is the world’s largest U.S.-headquartered outsourced semiconductor assembly and test (OSAT) provider, offering advanced packaging, wafer-level processing, and system-in-package solutions.
Upside Case: If both CPU HDFO programs reach volume production in H2 2026, AI accelerator packaging demand continues to exceed supply, and the Arizona facility ramps on schedule, Amkor could deliver meaningful earnings acceleration from Q3 onward, with 2027 consensus estimates rising substantially and the stock re-rating from cyclical OSAT to structural AI infrastructure play.
Downside Case: If the AI packaging ramp disappoints, one or more CPU programs slip to 2027, or Apple reduces packaging volumes, Amkor’s massive capex program could weigh on free cash flow and returns for multiple quarters, and the stock could retest its 2025 lows as the market questions the structural thesis.
Differentiation: Amkor’s unique position as the only U.S.-headquartered OSAT provider with scale advanced packaging capabilities, a TSMC partnership, and an expanding domestic footprint (Arizona) gives it irreplaceable strategic value in a geopolitically driven semiconductor reshoring environment.
Rambus (RMBS)

Bull Bullets: DDR5 Market Leadership and AI Data Center Demand Power Structural Revenue Growth
Rambus has successfully transformed from a patent licensing company into a semiconductor product leader, with 75% of revenue now coming from chips and silicon IP associated with AI and data centers. Product revenue reached a record $347.8M in 2025 (+42% CAGR over five years), and the DDR5 memory interface chip portfolio (RCD, MDB, PMIC, SPD, temperature sensors) positions Rambus as an essential infrastructure provider for every server DIMM deployed in hyperscale and enterprise data centers.
With 7 Buy ratings, 1 Hold, zero Sells, and a median price target of $107 (roughly 10% upside from $97), the analyst community views Rambus as a structural AI beneficiary with limited downside risk. The company’s expanding IP portfolio around MRDIMM, HBM4, and CXL interconnect technologies provides multiple growth vectors beyond the core DDR5 business.
Overall revenue has nearly tripled since 2020, free cash flow approaches $300M annually, and the recurring royalty stream ($61-$67M guided for Q1 alone) provides a high-margin floor that de-risks the earnings profile. Non-GAAP operating margins consistently run above 40%, making Rambus one of the most profitable semiconductor companies globally.
Bear Bullets: Q1 Supply Chain Disruption, Concentration Risk, and Elevated Valuation
Management disclosed a one-time supply chain issue that will trim “low double-digit millions” from Q1 product revenue, guiding total non-GAAP revenue broadly from $108-$172M with Q1 non-GAAP EPS of $0.56-$0.64. While normalization is expected in Q2, any recurrence of supply disruptions would raise questions about Rambus’s manufacturing dependencies and ability to scale product revenue linearly.
At approximately 46x trailing earnings and $128/share (above the $118 mean analyst target), the stock is priced for continued flawless execution in DDR5 adoption. Rambus’s heavy reliance on a single technology transition (DDR4 to DDR5) means any slowdown in server refresh cycles, a longer-than-expected DDR4 tail, or delays in MRDIMM/HBM4/CXL adoption timelines could cause a meaningful multiple compression.
The Q4 2025 earnings slightly missed both EPS and revenue estimates (-1.4% EPS surprise, -0.6% revenue miss), breaking a streak of consistent beats and raising the question of whether the DDR5 adoption curve is entering a less steep phase as early adopters have already upgraded and the next wave of demand depends on AI-specific DIMM configurations that are still in qualification.
Key Investment Thesis
Rambus delivers memory interface chips and silicon IP for data center and AI infrastructure, specializing in DDR5 memory controller technology that addresses the critical bandwidth bottleneck between memory and processing.
Upside Case: If DDR5 server penetration accelerates from the current roughly 50% to 80%+ by 2027, MRDIMM and CXL products begin contributing meaningful revenue in late 2026, and the Q1 supply chain issue proves truly one-time, Rambus could deliver $3.00+ EPS in 2027, justifying the premium multiple and supporting a path toward $130+.
Downside Case: If the DDR5 adoption curve flattens, enterprise server spending slows, MRDIMM adoption is delayed, or the supply chain issue proves symptomatic of broader manufacturing constraints, Rambus could see multiple compression toward 30-35x, pulling the stock toward $75-85.
Differentiation: Rambus’s unique combination of essential DDR5 silicon IP (used in virtually every server DIMM), high-margin patent licensing revenue, and next-generation interconnect technology (MRDIMM, HBM4, CXL) creates a multi-layer competitive moat around the memory-to-compute bottleneck that no other pure-play semiconductor company addresses as comprehensively.
Domino’s Pizza (DPZ)

Bull Bullets: Aggregator Expansion, Unit Growth, and Value Positioning Drive Compounding Returns
The UberEats and DoorDash partnerships remain in “early innings” internationally, and management expects continued same-store sales lift from third-party aggregator channels without cannibalizing core delivery volume. U.S. same-store sales guidance of 3% for 2026, driven by existing initiatives (Parmesan Stuffed Crust, Best Deal Ever, loyalty Rewards expansion) and higher order counts rather than pure pricing, demonstrates sustainable demand-side strength.
Store growth acceleration is a key catalyst: 172 net U.S. openings in 2025 (96 in Q4 alone) and guidance for 175+ net U.S. stores plus roughly 800 international net stores in 2026 represents a significant step-up. Average U.S. franchisee store profitability of approximately $166,000 in 2025 and management’s expectation for margin expansion in 2026 support continued franchisee enthusiasm for new unit commitments.
At a forward P/E of roughly 22.5x (vs. 5-year average of 28x) with consensus 2026 EPS of $20.04, DPZ is trading at a meaningful discount to its historical multiple. The 15% dividend increase, $460M remaining buyback authorization, and 18% U.S. pizza market share position Domino’s as both a defensive and growth compounder in an uncertain macro environment.
Bear Bullets: Input Cost Inflation, International Softness, and Aggregator Margin Dilution
Q1 2026 consensus EPS of $4.30 represents a slight year-over-year decline (-0.7%), and Zacks notes the Most Accurate Estimate sits below consensus with a negative Earnings ESP of -0.96%, suggesting analysts have recently become more cautious. Food cost inflation (cheese, flour, protein), rising minimum wages, and delivery labor costs continue to pressure franchisee unit economics despite top-line growth.
International same-store sales growth has been inconsistent, with macroeconomic challenges in key markets (Japan, UK, emerging markets) and foreign exchange headwinds potentially offsetting the contribution from new unit growth. If international SSS growth remains below 3%, the global growth narrative weakens.
The aggregator channel, while additive to volume, carries lower margins than direct digital orders (Domino’s own app/website) due to commission fees, and an increasing mix shift toward third-party platforms could structurally compress unit-level profitability even as top-line sales grow, creating a “growth without quality” concern.
Key Investment Thesis
Domino’s Pizza is the world’s largest pizza company by global retail sales, operating a franchise-heavy model (98%+ franchised) with over 22,000 stores across 90+ markets and an 18% U.S. pizza market share.
Upside Case: If U.S. same-store sales sustain 3%+ through aggregator-driven incremental orders, international unit growth accelerates toward 1,100+ net opens per year on the path to 7,000 net new stores by 2032, and franchisee profitability expands, DPZ could re-rate toward its historical 28x multiple, implying $560+ stock price.
Downside Case: If food and labor cost inflation accelerates, international growth stalls, and the aggregator mix shift compresses margins, DPZ could see earnings growth decelerate below the 10% consensus expectations, with the stock vulnerable to a pullback toward $330-350 if the market penalizes slowing momentum.
Differentiation: Domino’s proprietary technology platform (handling 85%+ of U.S. orders digitally), vertically integrated supply chain (18 dough manufacturing and supply chain centers), and franchise model with 98%+ franchise ownership create an asset-light, high-ROIC business model that generates $500M+ in annual free cash flow with minimal capital intensity.
Crown Holdings (CCK)
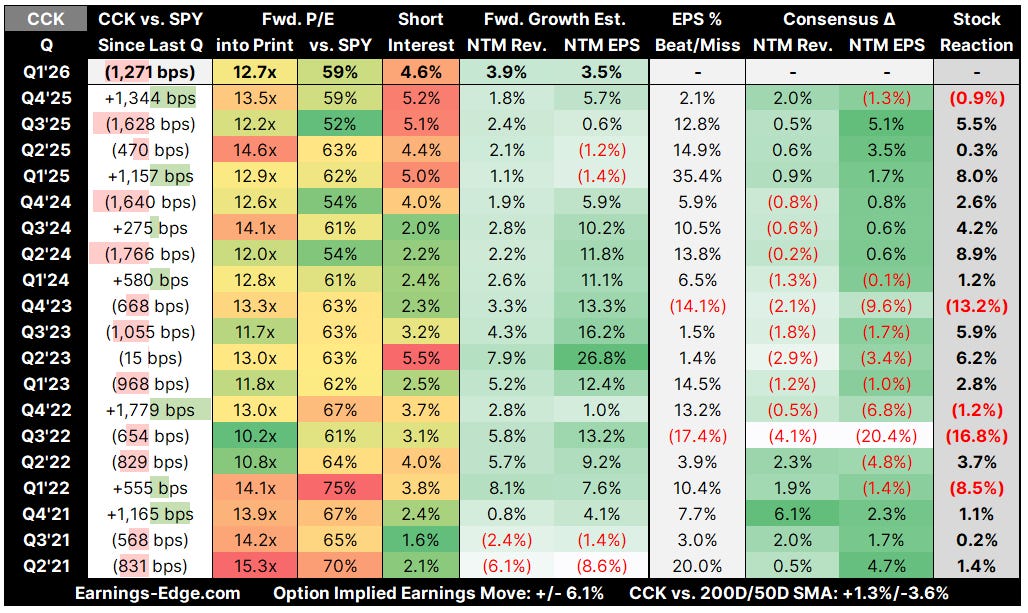
Bull Bullets: Global Beverage Can Adoption Trend and Record EBITDA Power Earnings Expansion
Crown’s global beverage can volumes grew 3% in 2025, with European volumes surging 10% YoY driven by structural substrate shifts from glass and plastic to aluminum cans. Management suggested investors could “pencil in 4-5%” European growth for 2026 and is “very bullish on Europe,” where ongoing beer conversion from glass across Mediterranean and Gulf State markets supports continued segment income gains that have already more than doubled in recent years.
2026 adjusted EPS guidance of $7.90-$8.30 represents 1-7% growth atop the record $7.79 in 2025, with adjusted free cash flow of approximately $900M. Over the past three years, Crown has increased adjusted EBITDA by 20% to a record $2.1B, and net leverage has declined to 2.5x, providing capacity for continued share repurchases and dividend growth alongside $550M in growth capex (Brazil, Greece, Spain facility expansions).
With 12 Buy ratings, 5 Holds, an average target of $124.40, and RBC recently raising to $140 “outperform,” analysts view CCK as a steady compounder benefiting from defensive end-market demand (beverages are non-cyclical), global expansion optionality, and the secular shift toward sustainable aluminum packaging.
Bear Bullets: Startup Costs, Tariff Pass-Through Risk, and North American Margin Pressure
New facility ramp-ups in Brazil, Greece, and Spain are generating elevated startup costs that are “second half weighted” in 2026, and management cautioned that North American beverage segment income could be “down a touch” due to inflationary pressures and tariffs, even as volumes grow 2-3%. This creates a near-term earnings quality concern where revenue grows but margins compress.
Tariffs on aluminum raw materials increase Crown’s input costs, and while pass-through mechanisms exist in most contracts, there is a lag effect and the potential for demand destruction if consumer-facing beverage prices rise materially. Transit Packaging results have been flat amid tepid industrial production, offering no diversification benefit if beverage demand softens.
Q1 2026 adjusted EPS guidance of $1.70-$1.80 implies a relatively modest sequential ramp, and the $900M free cash flow target is actually a decline from the record $1,146M in 2025, reflecting higher capex spending ($550M vs. $450M in 2025). If volume growth moderates and startup costs exceed expectations, the low end of the $7.90-$8.30 full-year range becomes at risk.
Key Investment Thesis
Crown Holdings is a global leader in metal packaging, primarily manufacturing aluminum beverage cans (the largest business), food cans, and specialty packaging across 40+ countries.
Upside Case: If European beverage volumes sustain 5%+ growth, North American volumes grow 3%+ driven by energy drinks, flavored alcohol, and sparkling water, and the new facilities in Brazil and Europe ramp efficiently, Crown could deliver at the high end of guidance ($8.30 EPS) and set up for further acceleration in 2027 as startup costs normalize, supporting a path toward $130+.
Downside Case: If beverage demand growth slows to 1-2% on consumer spending weakness, startup costs overrun expectations, and aluminum tariffs create margin compression that cannot be fully passed through, CCK could come in at the low end of guidance ($7.90) with muted 2027 expectations, and the stock could drift toward the $100-105 range.
Differentiation: Crown’s global manufacturing footprint (40+ countries), customer relationships with every major beverage company, and decades of metal-forming expertise create high barriers to entry in an industry where the top three players (Crown, Ball, Ardagh) control over 60% of global beverage can production, giving incumbents significant pricing power and customer lock-in.
I lean heavily into AI for the construction of the Bull / Bear discussions. Hallucinations may occur. This is investment analysis, not advice. Do your own due diligence. Please note that we provide commentary on the setup without a deep fundamental edge.
Spreadsheet with All of the Day’s Reporters