

What do you think about this format for the Setup tables, which now include high-level thoughts on trading approach? Are these useful? What should I add or subtract?
Examples for Tesla and UnitedHealth below:
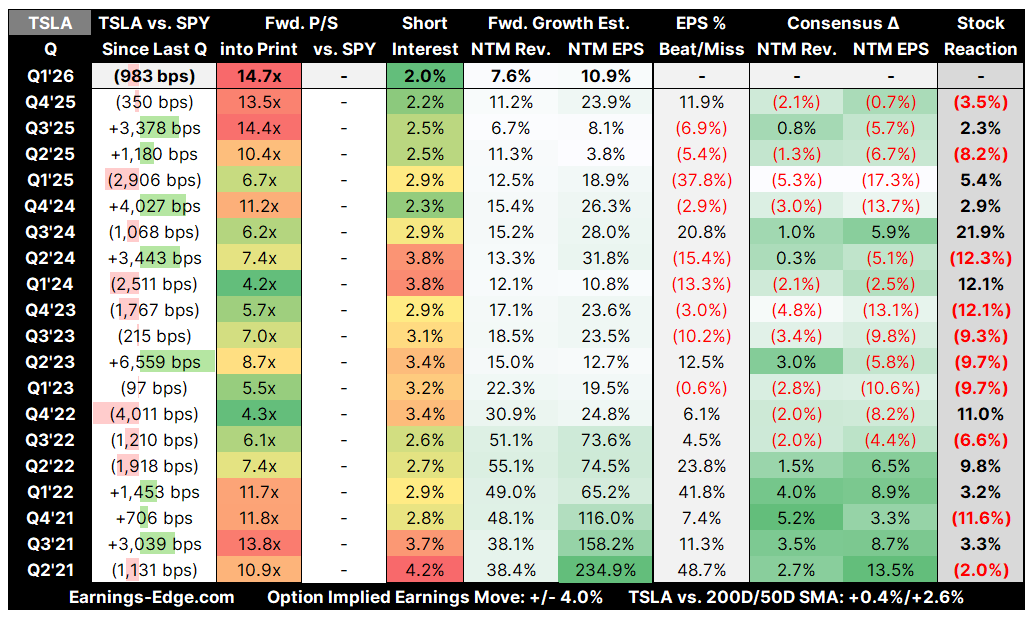
Looking at the data heading into Q1’26, the setup leans short (or at minimum, stay away). Here’s why:
Valuation is stretched. The 14.7x forward P/S is the highest in the entire table — above even the Q3’25 print (14.4x) which only got a +2.3% reaction despite a beat. You’re paying peak multiple into the print.
Relative performance has already faded. Down 983 bps vs. SPY since last quarter, which historically has been a mixed signal — but combined with the elevated valuation, it suggests the stock has given back some froth without getting cheap.
Forward growth estimates are uninspiring. NTM Rev growth at 7.6% and NTM EPS growth at 10.9% are near the lowest in the table. You’re paying the highest multiple for the weakest forward growth setup — that’s a bad combination.
The pattern on beats at high multiples isn’t great. Q3’24 (6.2x, +20.8% beat → +21.9%) worked because the multiple was compressed. Q4’22 at 4.3x got +11%. But when the multiple has been elevated (Q4’25 at 13.5x, beat of 11.9% → -3.5%; Q2’25 at 10.4x → -8.2%), beats haven’t been rewarded.
Short interest at 2.0% is low, so there’s no squeeze fuel to bail out longs on a miss.
Options are implying ±4.0%, so the market isn’t pricing in a huge move — but the risk/reward skews negative given the valuation/growth mismatch. A miss or even a meet could easily take it down 4-8%, while a beat at this multiple may get sold into (as Q4’25 showed).
The cleanest expression is probably a short or a put spread into the print, with the thesis that the multiple doesn’t deserve to expand further without a material growth re-acceleration.
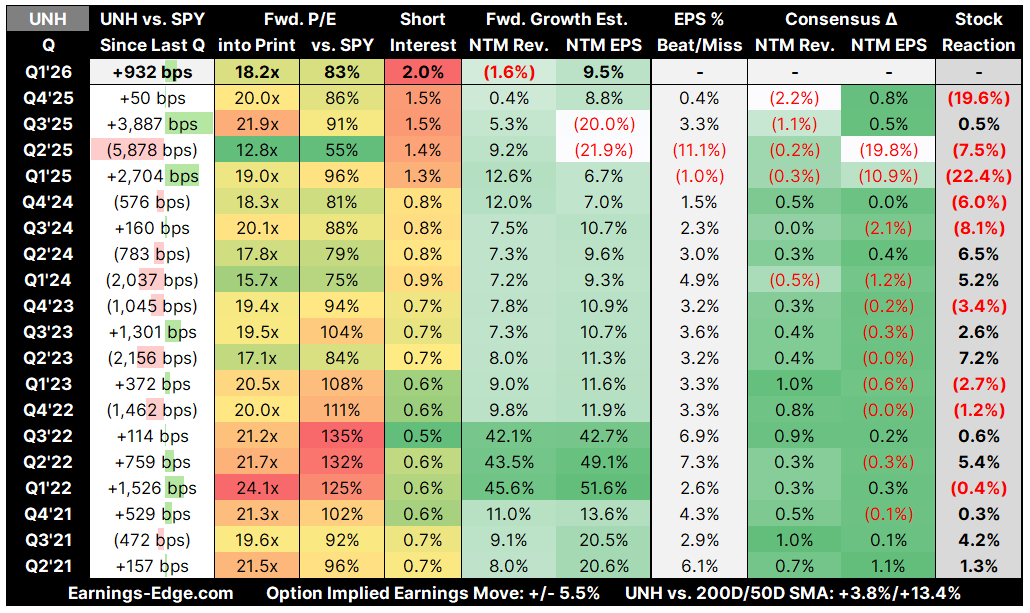
This one’s interesting — it leans long, but with caveats. Here’s the read:
Valuation has compressed meaningfully. 18.2x forward P/E is well off the 20-22x range it traded at through most of 2022-2023, and down from the 21.9x at Q3’25. At 83% vs. SPY, that’s the cheapest relative valuation since Q2’24 (75%) — and that quarter got a +5.2% reaction on a 4.9% beat.
The stock has been outperforming into the print. +932 bps vs. SPY is a strong run, which could cut both ways — but historically UNH has been rewarded when it comes in hot with a compressed multiple. Q1’25 (+2,704 bps, 19.0x P/E → +22.4%) and Q2’23 (-2,156 bps but 17.1x → +7.2%) show the pattern.
NTM Rev growth at (1.6%) is the red flag. That’s the worst in the entire table — negative forward revenue growth is ugly for a name that’s reliably grown top-line 7-12%. NTM EPS at 9.5% is fine but not exciting. If that negative rev growth estimate is right, it could cap upside.
The Q4’25 disaster is the elephant in the room. -19.6% on a 0.4% beat at 20.0x — that was a blowup driven by the medical cost ratio / guidance issues, not the beat/miss itself. The question is whether that risk has been repriced at 18.2x and 83% relative.
Consensus revisions aren’t visible yet for Q1’26, but the prior pattern shows analysts have been cutting — the stock is trading like expectations have been reset.
Short interest at 2.0% is elevated for UNH (historically 0.5-1.5%), which adds squeeze potential on an upside surprise.
Options imply ±5.5%, and the stock is trading well above both the 200D and 50D (+3.8%/+13.4%), suggesting momentum support.
The bull case: Expectations and valuation have been reset after the Q4’25 blowup, the stock has been recovering, and a clean print with stabilizing medical cost trends could squeeze shorts and push it 5-8% higher. The compressed relative valuation gives you a margin of safety you rarely get with UNH.
The risk: If medical cost pressures persist or guidance disappoints again, the Q4’25 playbook repeats and the +932 bps run gets unwound.
Net, I’d lean long — the valuation reset and elevated short interest tilt the risk/reward favorably, but I’d size it smaller than normal given the tail risk from the cost ratio narrative.
love the format but just make sure you put on it "investment analysis, not investment advice, do your own due diligence" or something similar in a rather prominent spot
I prefer this over previous format since it calls out implied move and potential lean signal long, short or neutral.
It’d be great if
- we can add at what price point it’s a short or a long
- is option market betting in one specific direction?